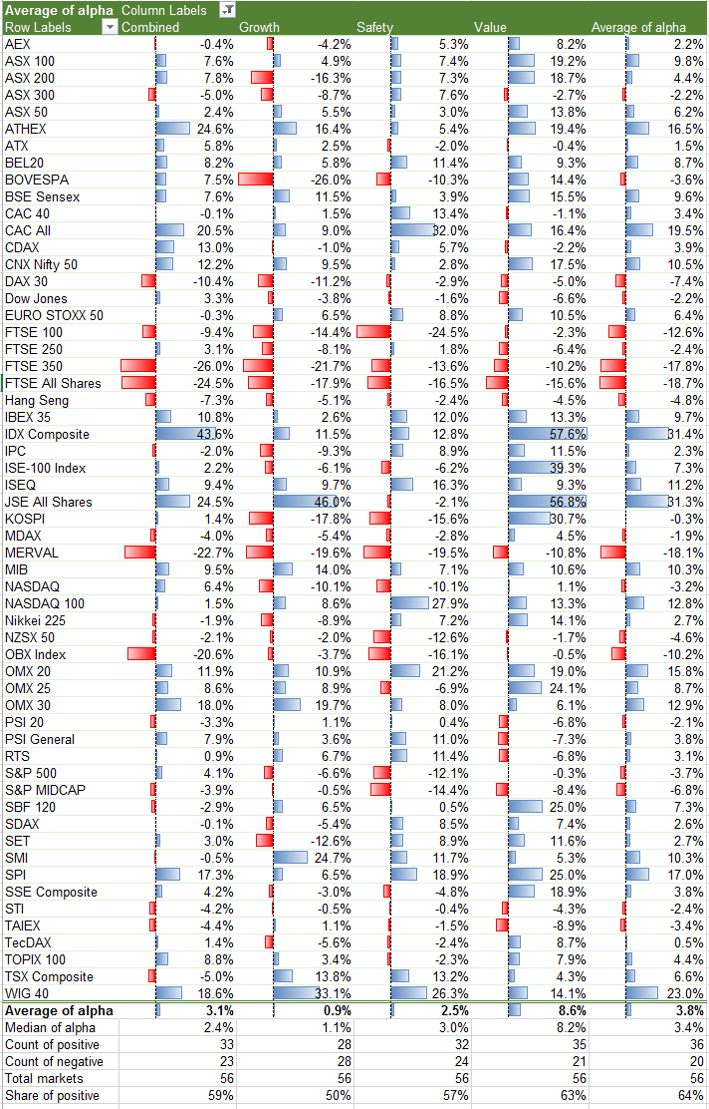
In 2016, the Obermatt value investment strategy was ranked the best. The Value Top 10 stock lists of the 56 index markets covered by Obermatt had an average return of 8.6%, based on the respective benchmark indexes (Figure below, focus markets were excluded because no returns are available for these markets).
The combined strategy was 3.1% better and the security strategy was 2.5% better than the corresponding index investments. The poorest performance achieved was with the growth strategy, with a yield that was only 0.9% higher than the benchmark index.

As a result, the Obermatt stock ranks have again outperformed the indexes, as also did in 2015 and 2014. To see how well the Top 10 lists in the individual markets performed, see the Top 10 Returns.
We have calculated these figures as follows: For each of the 56 markets with Top 10 Stocks, we have matched the annual returns for 2016 (January to December) of the market with the yield of the Top 10 stocks for each strategy. If the return on the Obermatt Top 10 Stocks was higher, we outperformed the market with a more positive result. If a new Top 10 list was published during the year, the new list replaced the old list as of the publish date. The average of all out- and under-performances in the 56 markets for the four investment strategies Value, Growth, Safety, and Combined are shown here. The individual returns for the markets are available as a downloadable image at the bottom of the article. The original data is available to interested parties upon request.
Another method to assess the Obermatt ranks is through the performance of the Obermatt stock portfolios during their first and second investment season. As of November / December 2016, success reviews have been released on our Blog. The portfolios were about equal in value as of the beginning of investment activity.
Top 10 Returns per index: