The Obermatt Top 10 stocks were better than all the indexes in 2015 (orange bars in the graphs). On average and across all 51 markets worldwide, Top 10 stocks outperformed the indexes by almost 4%. Compared to your typical bank and their financial products, this means that Obermatt investors are up +6% because the financial services industry typically sets you back 2% (if they are nice).

Even better: Obermatt Top 10 stocks were better than the indexes in 71% of all 204 cases (4 strategies times 51 markets: 204 observations).
The growth strategy was the best: the Top 10 growth stocks had the highest return in 2015. This is in line with what the experts say about 2015. Most people just bought stocks that already had a positive momentum. Value didn't count much last year. That’s actually a sign of a bubble. No wonder the stocks collapsed in the first weeks of the new year.
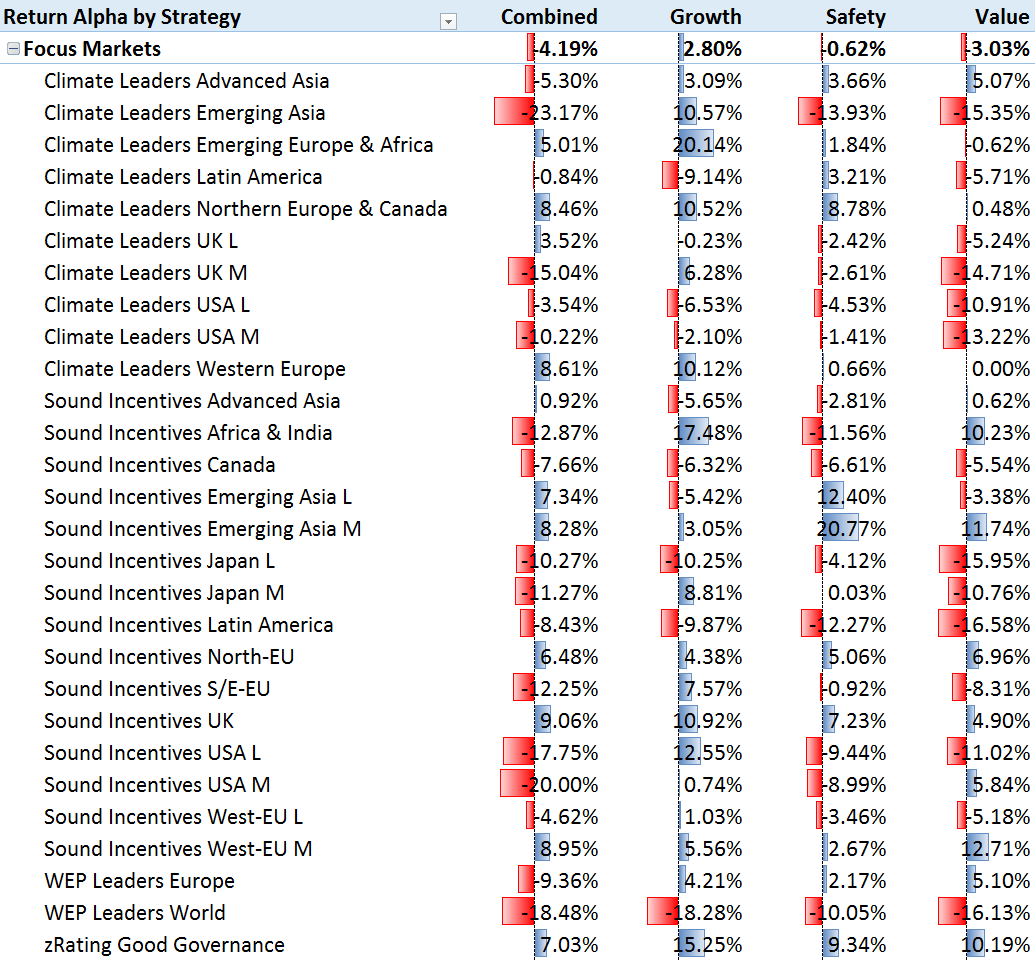
It was interesting to see that all the Obermatt focus markets performed better than the normal indexes. This is in line with Obermatt’s opinion that the indexes are a mixed bunch of stocks. Better to use some basic selection - such as common sense or the Obermatt Top 10 stocks - than just invest in every company that went public (for whatever reason whatsoever).
And the good news is: In 2015 you only had to stick with women/family friendly stocks to get a good return (graph below). The Obermatt family friendly stocks generated a return of almost 10% (compared to the overall market which was closer to 3% last year). Good deeds paid, in 2015.
The Obermatt investment strategies outperformed the stock indexes by 6% (Value, Growth and Safety strategy) and 5% (Combined strategy). This means that the Obermatt Top 10 stocks on average did 5-6% better than the corresponding stock indexes themselves.

Here you will find all alpha returns of covered Obermatt markets:
The overviews show the Obermatt top 10 stocks relative to the index and focus markets. Blue indicates a performance above and red below the market.
The length of each bar shows how much the Obermatt Top 10 stocks out- or underperformed each market.
Click on the market category below to see each market performance.
Index
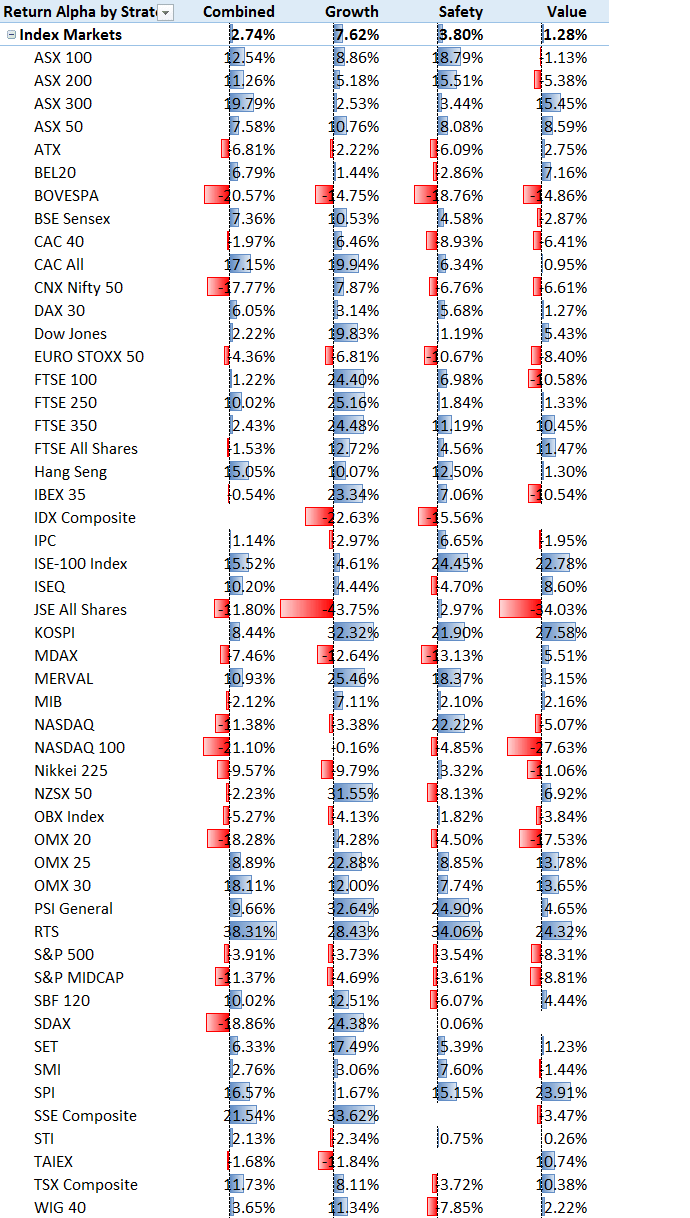
Focus