After discussing Italy, Spain and Portugal we turn to the third and biggest mistake for stock investors: Japan's lost two decades.
We have analyzed the last two decades more closely. It is true that the Japanese stock index fell from 20,618 at the beginning of 1996 to 19,554 points at the end of 2016 (orange line in the graphic).
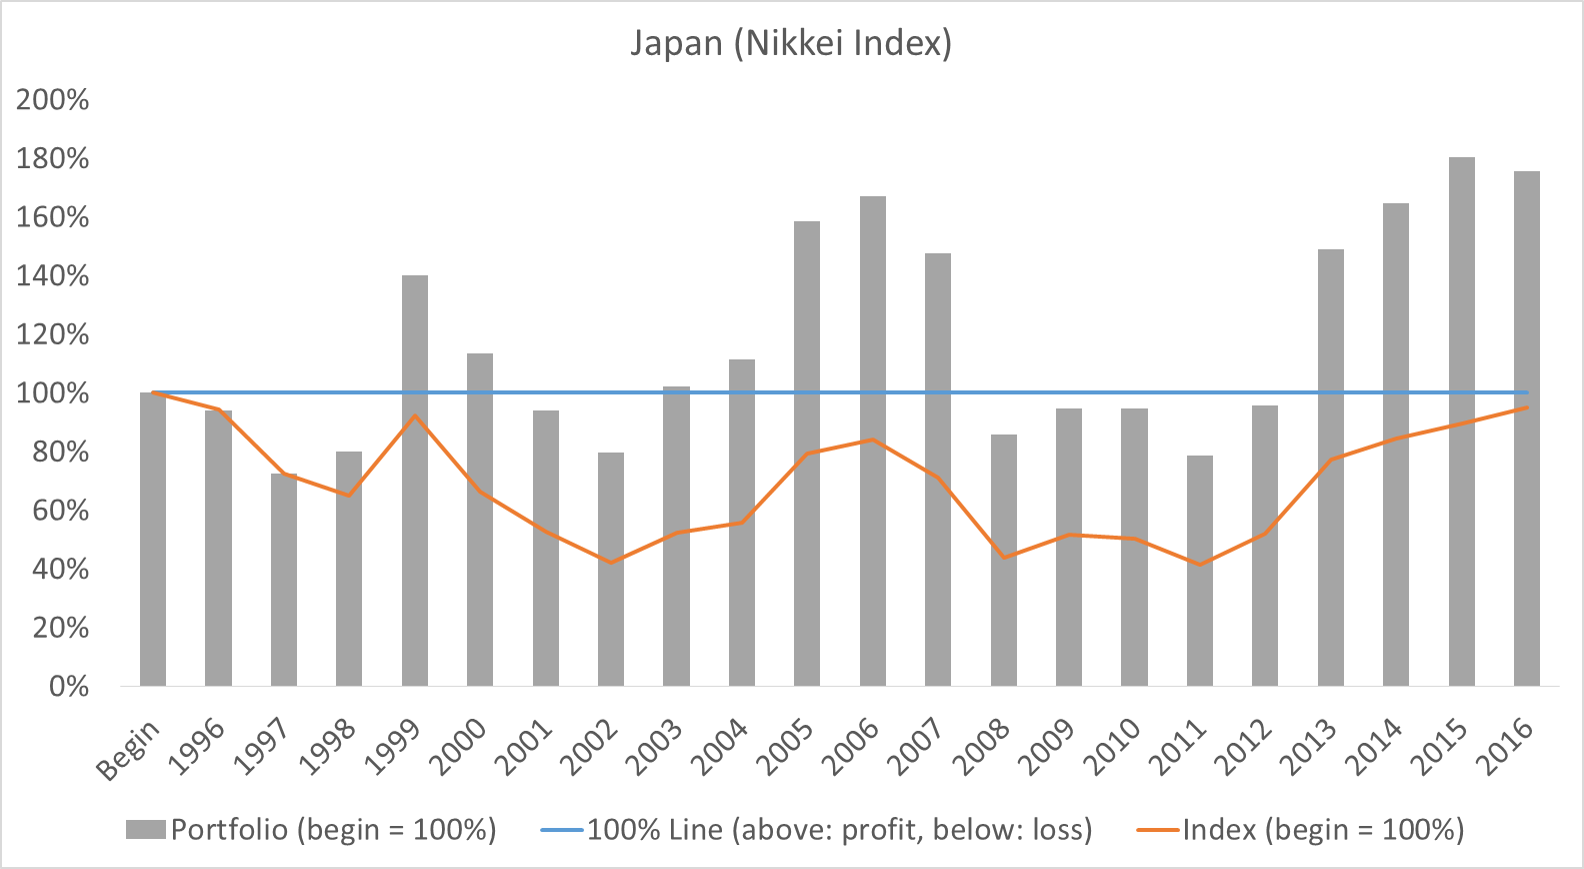
However, it’s a mistake to assume that this was bad for investors, because the stock index values are both wrong and unrealistic. They are wrong because they do not consider dividends and they are unrealistic because they assume that all money is saved at the beginning.
Therefore, in the graphs, we have taken into account the dividends and have assumed that each year the same amount is invested in the largest Japanese equities. If the value is over 100%, then the portfolio is worth more than the deposit, it is below 100%, then you have lost money on the investment.
The bars show that Japanese savers who started saving in stocks in 1996 have had a wild time, but now have 176% of the deposits. Stock saving has even paid off in one of the most difficult countries in the world.
If someone tells you that you have lost money somewhere with stocks, then you better calculate yourself, because the statement is probably based on false assumptions and is only true for a short time.
In the long term you can hardly lose money with stocks because as a shareholder you have the help a legion of highly qualified managers, who primarily want to make a profit for shareholders, because their job and their own retirement pensions depend on it. What more do you want as a saver?
How we made our calculations: We have purchased all the data from Standard & Poor's, i.e. we do not calculate our own return by ourselves but are licensed by one of the largest financial data providers. In order to calculate the gray bars, that is, the stock deposit value for a saver who invests in large Japanese stocks every year, we took the largest 100 Japanese stocks each year, and their return plus dividend was purchased by Standard & Poor's. We then assumed that each stock has the same meaning in the stock depot account and thus calculates the total return and the stock depot value at the end of the year. This is the closest way to determine the typical stock deposit of a saver. We have divided this amount by the sum of all annual payments. If the current value of the stock deposit is higher than the sum of all deposits, then the bar is over 100%. The bar is less than 100% if there has been a loss.