A higher return, meaning the percentage change in the stock value compared to the previous year, month or day, is better than a low return – that makes sense. However, that’s not always the case.
The timeframe you look at is decisive for making good decisions, and investors have a tendency to focus on the short run when it comes to stocks.
However if you only look at the last few quarters or years, you may be wrong. That’s because this perspective only reveals a specific part of the whole picture – sometimes one with a positive tendency and sometimes one where things look more negative.
Guessing the future based on this information is about as meaningful as deducing after a rainy day that the sun will never shine again.
As the following chart shows, the return of security 1 in blue is higher and therefore more profitable than the return of security 2 in red. However, there are various sections when it looks like the opposite is true: specifically, when the returns overlap.
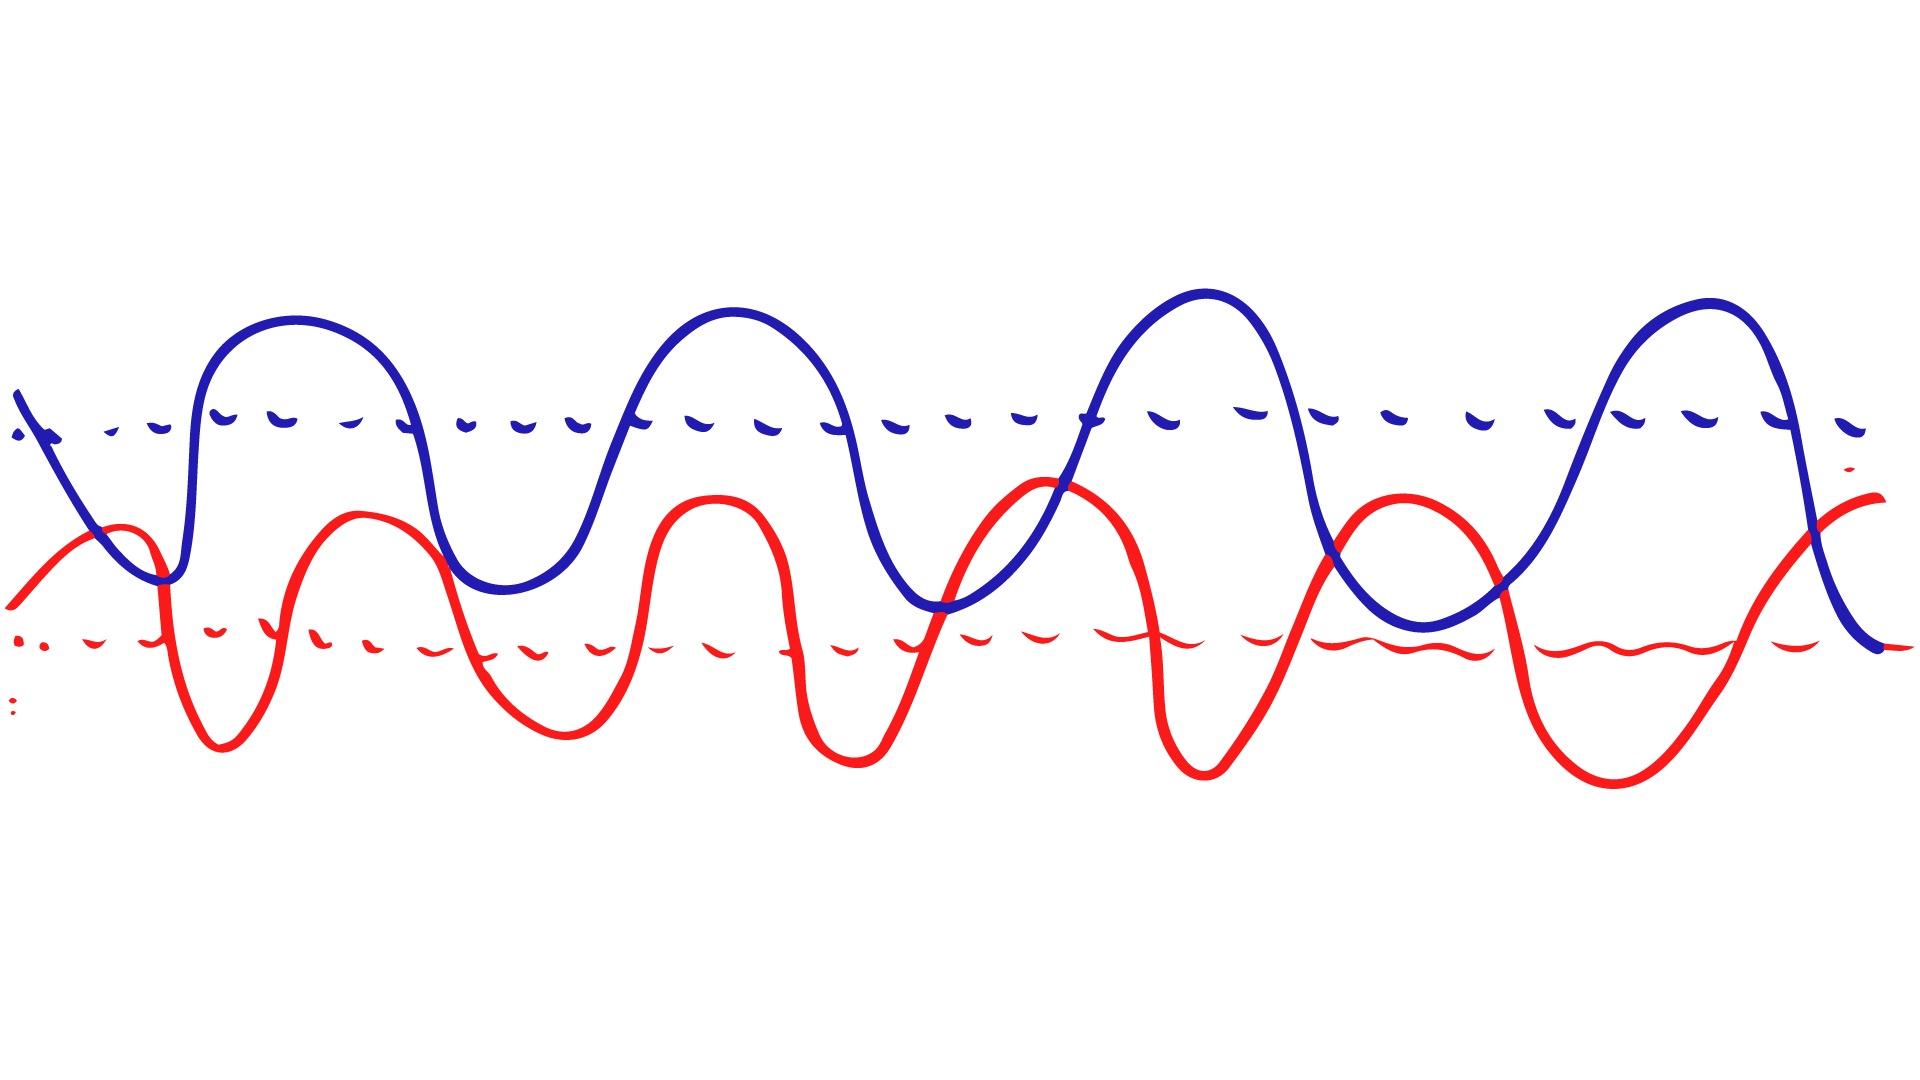
This happens four times: The red return increases and exceeds the falling blue return. If you only look at this specific point in time, for instance when reading the daily paper or looking at a stock portfolio, then this tunnel vision will give you the impression that it’s a good idea to invest in security 2 or sell security 1.
Looking at the entire development of both curves shows clearly which stock you should bet on. You can only gain this insight if you look at returns in the long run – and if you learn to understand their fluctuations.
Fluctuations can easily be in the double digits and thereby produce completely distorted snapshots. For this reason, it is recommended that investors develop a "patient outlook".