The newly coined term, "fake news" has been all the rage since the US election. What fewer people know is the fact that there are also "fake stock news". For example, the reports that investors would have lost money by buying stocks from Italy are not entirely accurate. The Milano stock market index, MIB, is a case in point (orange line in the chart). With a baseline of 100%, measured at the end of 2000, it was 46% at end of 2016 (down from 42,758 to 19,566). That appears to be terrible performance and, therefore, investment in Italian stocks should be avoided. But is that real or fake?
It’s fake because the MIB index number is misleading and unrealistic for investors!
The number is misleading because the dividends are not taken into account. This is the case with most stock index numbers because the index values would become too complicated with dividends. If you want an accurate measure, you have to calculate for "total return". However, these values are only provided by stock exchanges at your own expense, so you will rarely find them in the press.
The number is also unrealistic because you don’t invest all your money in the beginning and then wait for 20 years for your return. It’s more likely that the investments are spread out equally over the term. That’s how investments usually work in real life.
We adjusted the numbers and have displayed the results in bar form (image below).
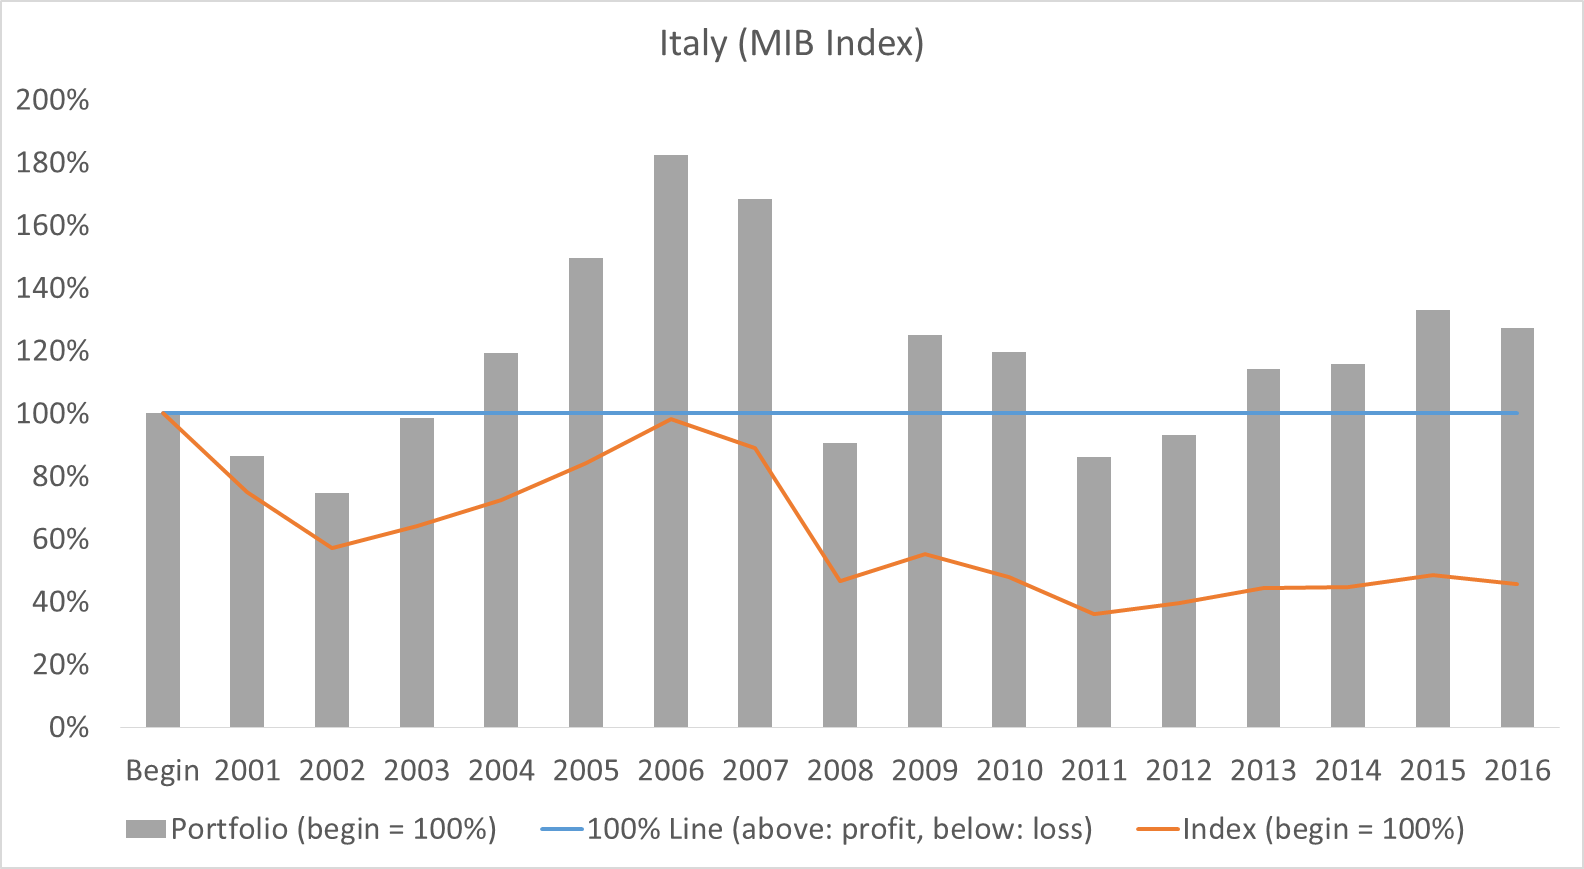
The bar indicates how much the asset is worth when it is divided by the amount invested. The same amount is invested each year. If the bar is over the blue line, the value of the asset is higher than the investment, and vice versa.
So, if you started to invest in Italian stocks at the end of 2000, you were dissatisfied with the portfolio for two years because the value was lower than the investment. But, as early as 2003, the tide turned, and investors were happy in the following years.
In 2008, the worst financial crisis of our generation, there was bound to be another negative year. And, more importantly for Italy, investors were only "underwater" for the two years that followed and then again in the positive, despite a record of poor economic development.
Since then, the average investor has earned 22% over the amount of original investment. For those afraid of losses, the portfolio value was only negative in one year out of three. The other years were good, sometimes very good.
This has all taken place in one of the worst countries for shareholders where the stock index has fallen by 54%. Despite the negative reporting, the average investor had a decent return on his investment. This was clearly an example of "fake stock news".
How we made our calculations: We have purchased relevant data from Standard & Poor's, i.e., we do not calculate the return on our own, but are licensed by one of the largest financial data providers. In order to calculate the gray bars, that is, the overall portfolio value for an investor, who invests in large stocks of the country every year, we have taken the largest 20 stocks in the country for each year and calculated their return, plus dividends from Standard & Poor's. We then assumed that each stock has the same value in the portfolio account and then calculated the total return and the portfolio value at the end of the year. This is the closest approximation to a typical investor. We have divided this amount by the sum of all annual investments. If the current value of the portfolio is higher than the sum of all investments, then the bar is over 100% and less than 100%, if there were losses.