Searching for stock ideas? Explore other Top 10 lists, filter for stocks with our stock filter, or search for individual stocks by signing up.
|
Name
|
360° View
|
Sentiment
|
Combined
|
Value
|
Growth
|
Safety
|
|---|---|---|---|---|---|---|
|
M •
Oil & Gas Production
|
92
|
63
|
98
|
87
|
39
|
84
|

DNO stands out in the OBX Index with a 360° View of 92, placing it ahead of 92% of its peers.
See the full DNO analysis|
Name
|
360° View
|
Sentiment
|
Combined
|
Value
|
Growth
|
Safety
|
|---|
No top 10 list was published for this market, date and strategy.
Our lists are generated by a proprietary algorithm that analyzes over 6,500 stocks weekly.
Stocks are ranked by our 360° View, which measures all-around strength in Value, Growth, Safety, and Sentiment.
The results are completely data-driven and independent, free from market hype or analyst opinion.
The Obermatt Top 10 lists are algorithmically generated lists that identify the 10 stocks in a specific market or index with the highest 360° View. The holistic 360° View ranking consolidates into one number a company's overall fundamental financial strength and its market sentiment as compared to its peers.
The OBX Index measures the performance of the 25 most traded stocks on the Oslo Stock Exchange in the past 6 months.
The stocks that top Obermatt's OBX Index list are often not the stocks that are the most popular or the most hyped. Those are often over-priced. Obermatt selects stocks based on performance, not hype.
The Top 10 OBX Index stocks are updated on the 10th day of every month.
Any visitor can view the 360° View of the last three stocks on the OBX Index list. A Premium subscription is required to unlock the complete list with the ranks for not only the 360° View but also the Value, Growth, Safety, Combined and Sentiment ranks. Obermatt's objective, data-driven analysis is financed by our subscriptions.
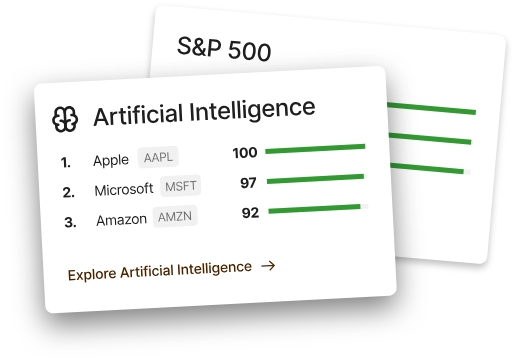
Obermatt's proprietary Investment Themes are a response to investor demand to find the best stocks according their interests, be they high growth areas like AI, Robotics, Renewables, or sustainability values like Governance Leaders, Diversity Leaders or Climate Leaders.
Ready to Elevate Your Investing?
Choose the Obermatt subscription that best fits your needs.
 Top 10 Market ListsSimilar Stocks1 WatchlistDelivered to your inbox Top 10 Market Lists Similar Stocks
 Stock Filters 6 key ranks for 6,500+ stocks 3 Watchlists Delivered to your inbox Top 10 Market Lists Similar Stocks Stock Filters Investment Themes 6 key ranks for 6,500+ stocks
15 more detailed ranks 3 years of historical ranks Unlimited Watchlists Delivered to your inbox
Stock Filters 6 key ranks for 6,500+ stocks 3 Watchlists Delivered to your inbox Top 10 Market Lists Similar Stocks Stock Filters Investment Themes 6 key ranks for 6,500+ stocks
15 more detailed ranks 3 years of historical ranks Unlimited Watchlists Delivered to your inbox
30-day money back guarantee. Your subscription will renew until you cancel it, which you can do at any
time.
See how Obermatt improved their investing: